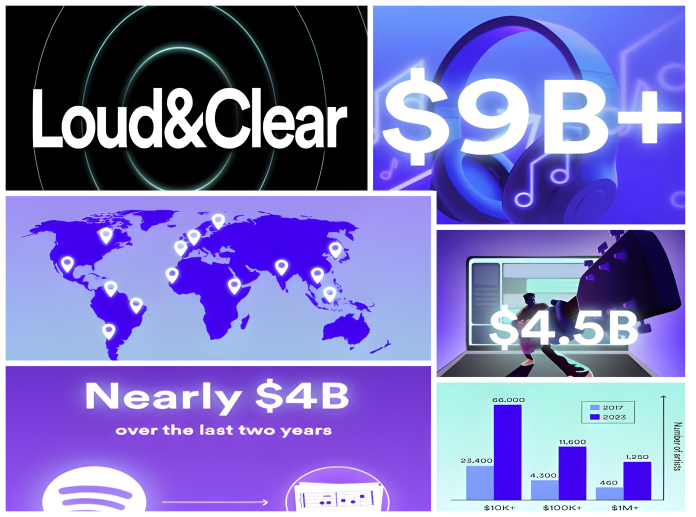
For musicians, music streaming has been a financial enigma wrapped in an algorithm. Millions of streams accrue, but how much does it translate to in their pockets? Spotify, the music giant, is finally cracking open the black box with this year’s Loud & Clear report, a website dedicated to demystifying music streaming economics with hard data. Buckle up, musicians, because these numbers are about to get really interesting.
Coincidentally, Spotify’s report has seen the light of day just in the middle of the whole artists’ royalties discussion going on, given the Living Wage for Musicians Act recently proposed by House Representatives Rashida Tlaib and Jamaal Bowman. See what the brand has to say on their side of the sphere.
Payout Party: A Record-Breaking Year
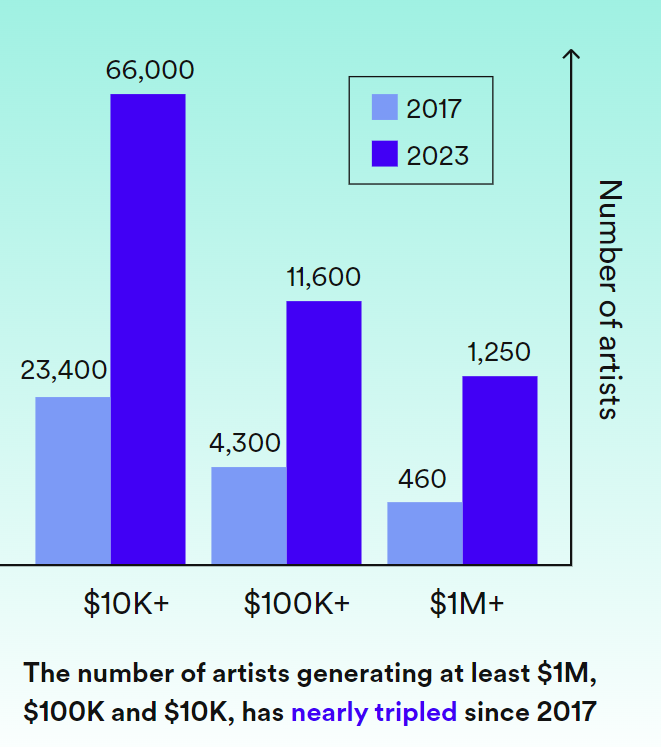
Let’s kick things off with the headline stat: Spotify dished out a record-breaking $9 billion+ to the music industry in 2023 alone. That’s a nearly threefold increase over the past six years. This represents a significant rise in artist payouts, highlighting the undeniable potential of streaming revenue.
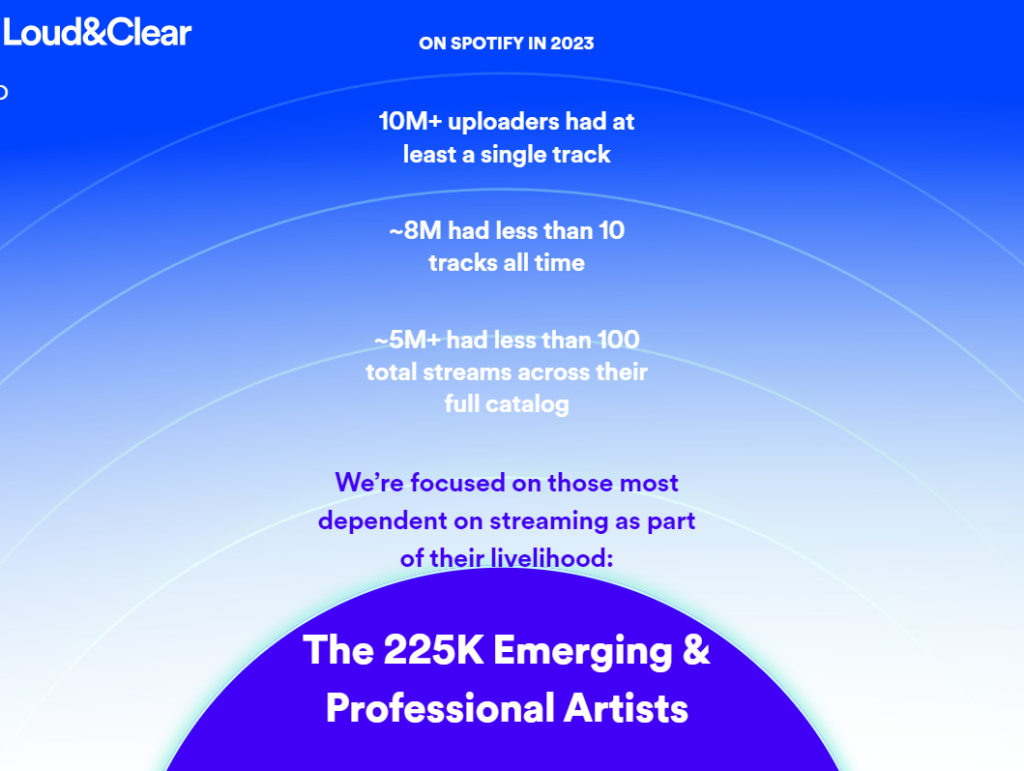
A Sea of Artists, a River of Royalties: Here’s a number that might surprise you: over 10 million artists have uploaded at least one track to Spotify. That’s a vast ocean of talent vying for attention. While the dream of becoming the next global superstar exists, the financial reality is unevenly distributed.
The Long Tail Struggle: Not All Streams Are Created Equal
Loud & Clear dives deeper, revealing a crucial truth: the streaming game is fiercely competitive. Here’s a stat that paints a vivid picture: a staggering 5 million artists haven’t even cracked 100 streams across their entire catalogue. That’s half of the artists on the platform! This highlights the long tail of streaming, where countless talented artists are battling for that breakout moment.
Breaking Down the Buckets: Who Gets Paid, and How Much?
Money doesn’t magically appear when someone hits play. Loud & Clear sheds light on how those payouts are actually divided. Here’s a breakdown, with some key figures:
- Artists: This is the big one! A portion of each stream goes directly to the artists (or their rights holders) behind the music. The exact amount depends on factors like streaming agreements and royalty splits, but Spotify emphasizes they pay out more than any other streaming service.
- Songwriters and Publishers: Don’t forget the folks behind the tunes! Songwriters and publishers receive a share, typically around 10-15%, of the royalties for their creative contributions.
- Streaming Services: Let’s not forget Spotify itself. They take a significant cut, typically around 50%, to cover operational costs like licensing fees, maintaining the platform, and marketing.
Beyond Spotify: The Global Streaming Landscape
While Spotify boasts a massive user base, they understand they’re not the only game in town. The total global recorded music revenue pie is much bigger, with estimates suggesting streaming services contribute over 20%. This reminds artists that diversifying their presence across multiple platforms can be a smart strategy to capture a larger slice of the pie.
Numbers for the Win: Data-Driven Decisions for Musicians
Loud & Clear provides access to valuable data on royalty payouts and listener statistics – essentially, how much your music is earning and where your fans are located. This intel is a game-changer. Imagine being able to see which countries stream your music the most (over 329,000 songs were streamed over a million times in 2023 alone) and tailor your marketing efforts accordingly.
The Future of Streaming: Transparency Is Key
Loud & Clear is the platform’s effort towards a more transparent music streaming industry, they say. By revealing these numbers and empowering artists with data, Spotify is fostering a more informed and empowered music community. This newfound knowledge allows artists to navigate the complexities of the streaming world with greater confidence, make data-driven decisions about their careers, and ultimately, maximize their musical impact.
Check out the full article and key figures on the website here.


